A descriptive profile of 913,443 direct-to-college enrollees answering who stops out and what we can predict years before they leave.
Texas leaders have set ambitious goals for increasing degree and credential attainment with the Building a Talent Strong Texas strategic plan for higher education. More Texans earning degrees and credentials of value is essential for continuing to grow the Texas economy and for the economic mobility of Texans. But we know that too few Texans are meeting that attainment goal, with only 54% of Texans ages 25-34 holding a degree, certificate, or credential of value as of 2023 (Building a Talent Strong Texas, 2025).
To better understand the population of students who leave college before earning that degree or credential, Gabe Grantham and Jaquelyne Bardales at Philanthropy Advocates worked with Dr. Jacob Kirksey, associate professor of education policy at Texas Tech University, to study Texas stopouts. Over the next several months, we will be releasing additional analysis of this population and starting a conversation about what Texas can do to help support these students.
More than a third of Texas college entrants stop out and leave without a credential. Within six years of entering Texas public higher education, 347,061 students left without earning a credential. Building a Talent Strong Texas establishes a goal of 60% of adults holding a credential by 2030. With 38% of its direct entrants leaving within six years, it will be difficult to achieve that goal.
What is a Stopout
A stopout is a student who left Texas public higher education for more than a year without a credential. We use stopout rather than dropout deliberately. Treating them as permanently lost overstates the finality of the departure and distracts from asking what would bring them back and what would have kept them enrolled. In this profile, the population is Texas public high school graduates from the classes of 2017 through 2022 entering college directly. We look at students entering and pursuing education at both public two-year and public four-year institutions. This profile looks at 913,443 direct-to-college enrollees two years since college enrollment, then at six years.
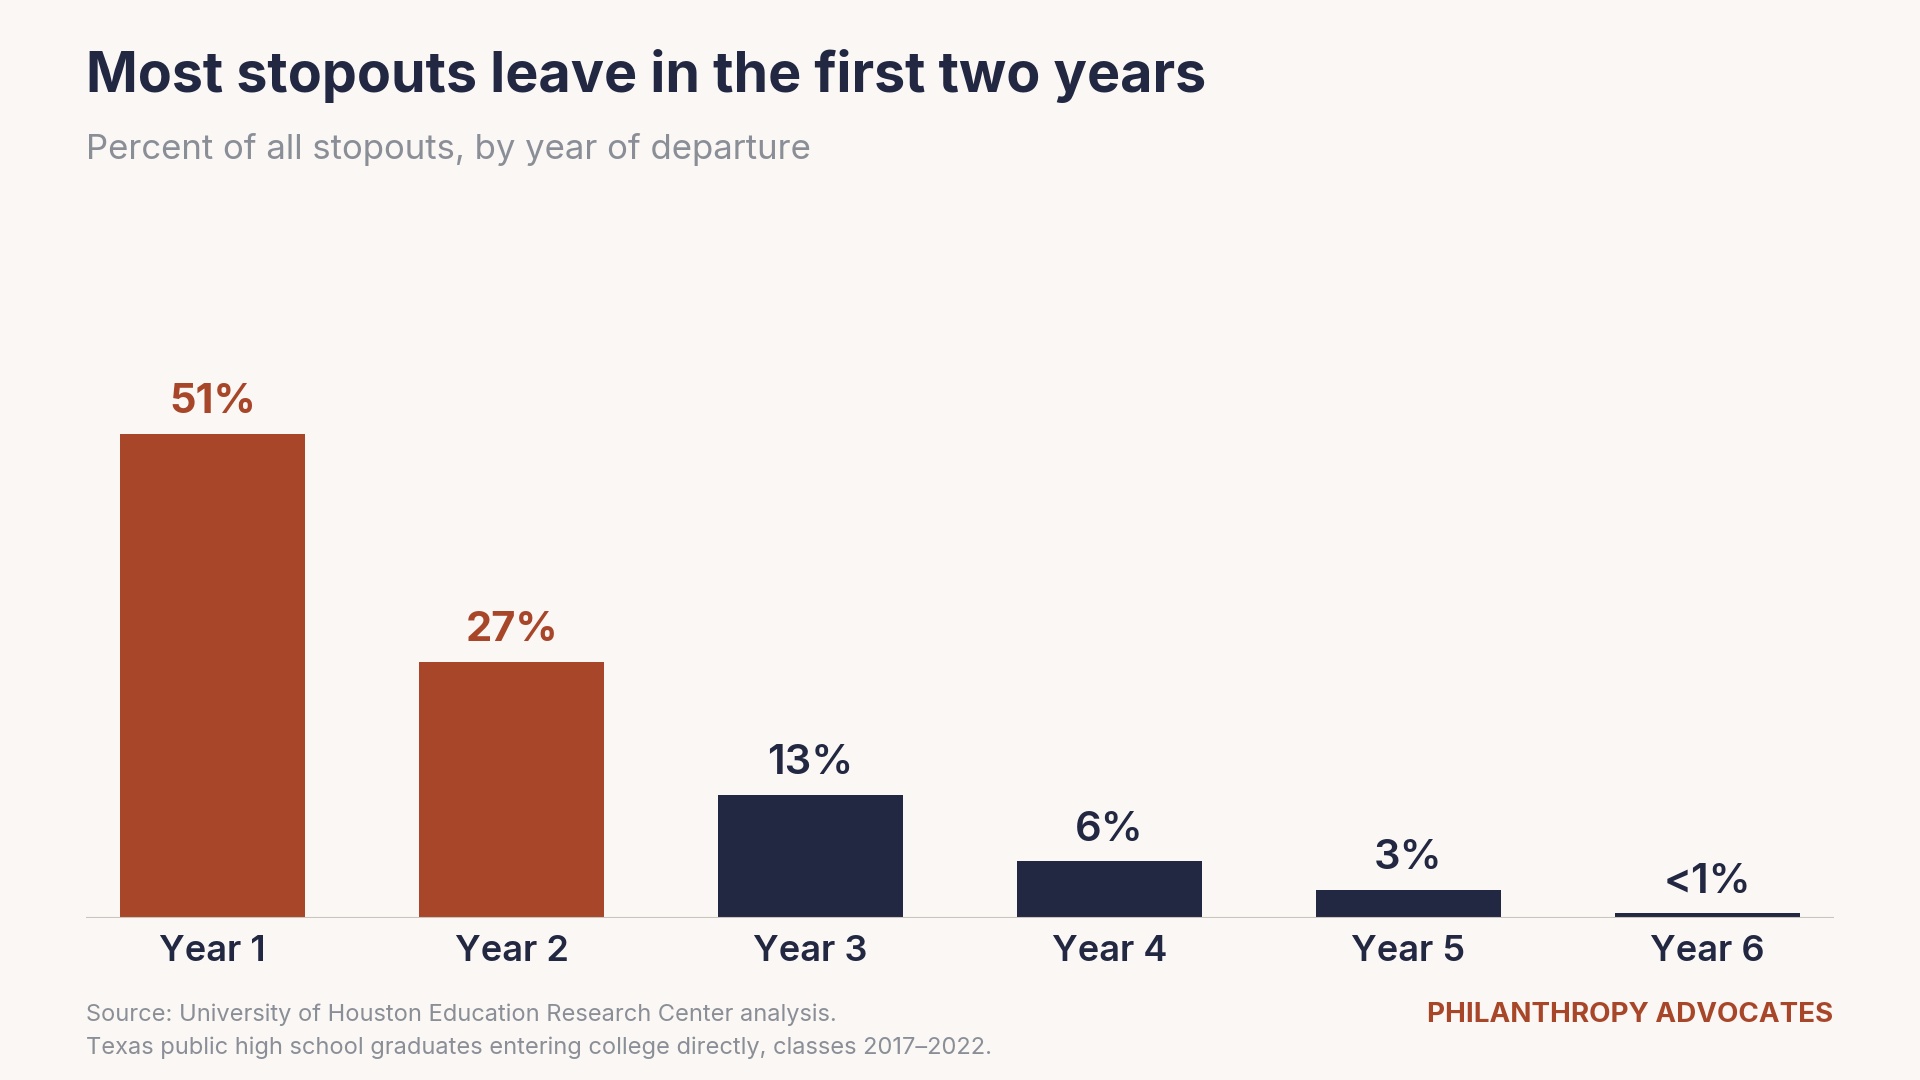
Six years is the standard window in completion research and reflects how state and federal completion rates are calculated, representing 150 percent of normal time to a bachelor’s degree. But what we see is that stopping out happens early. Half of all stopouts leave during year one, and 78% exit by the end of year two. That is why we also report a two-year window. Six years defines the population traditionally, but two years is where the vast majority of attrition occurs.
The institutions where stopouts start
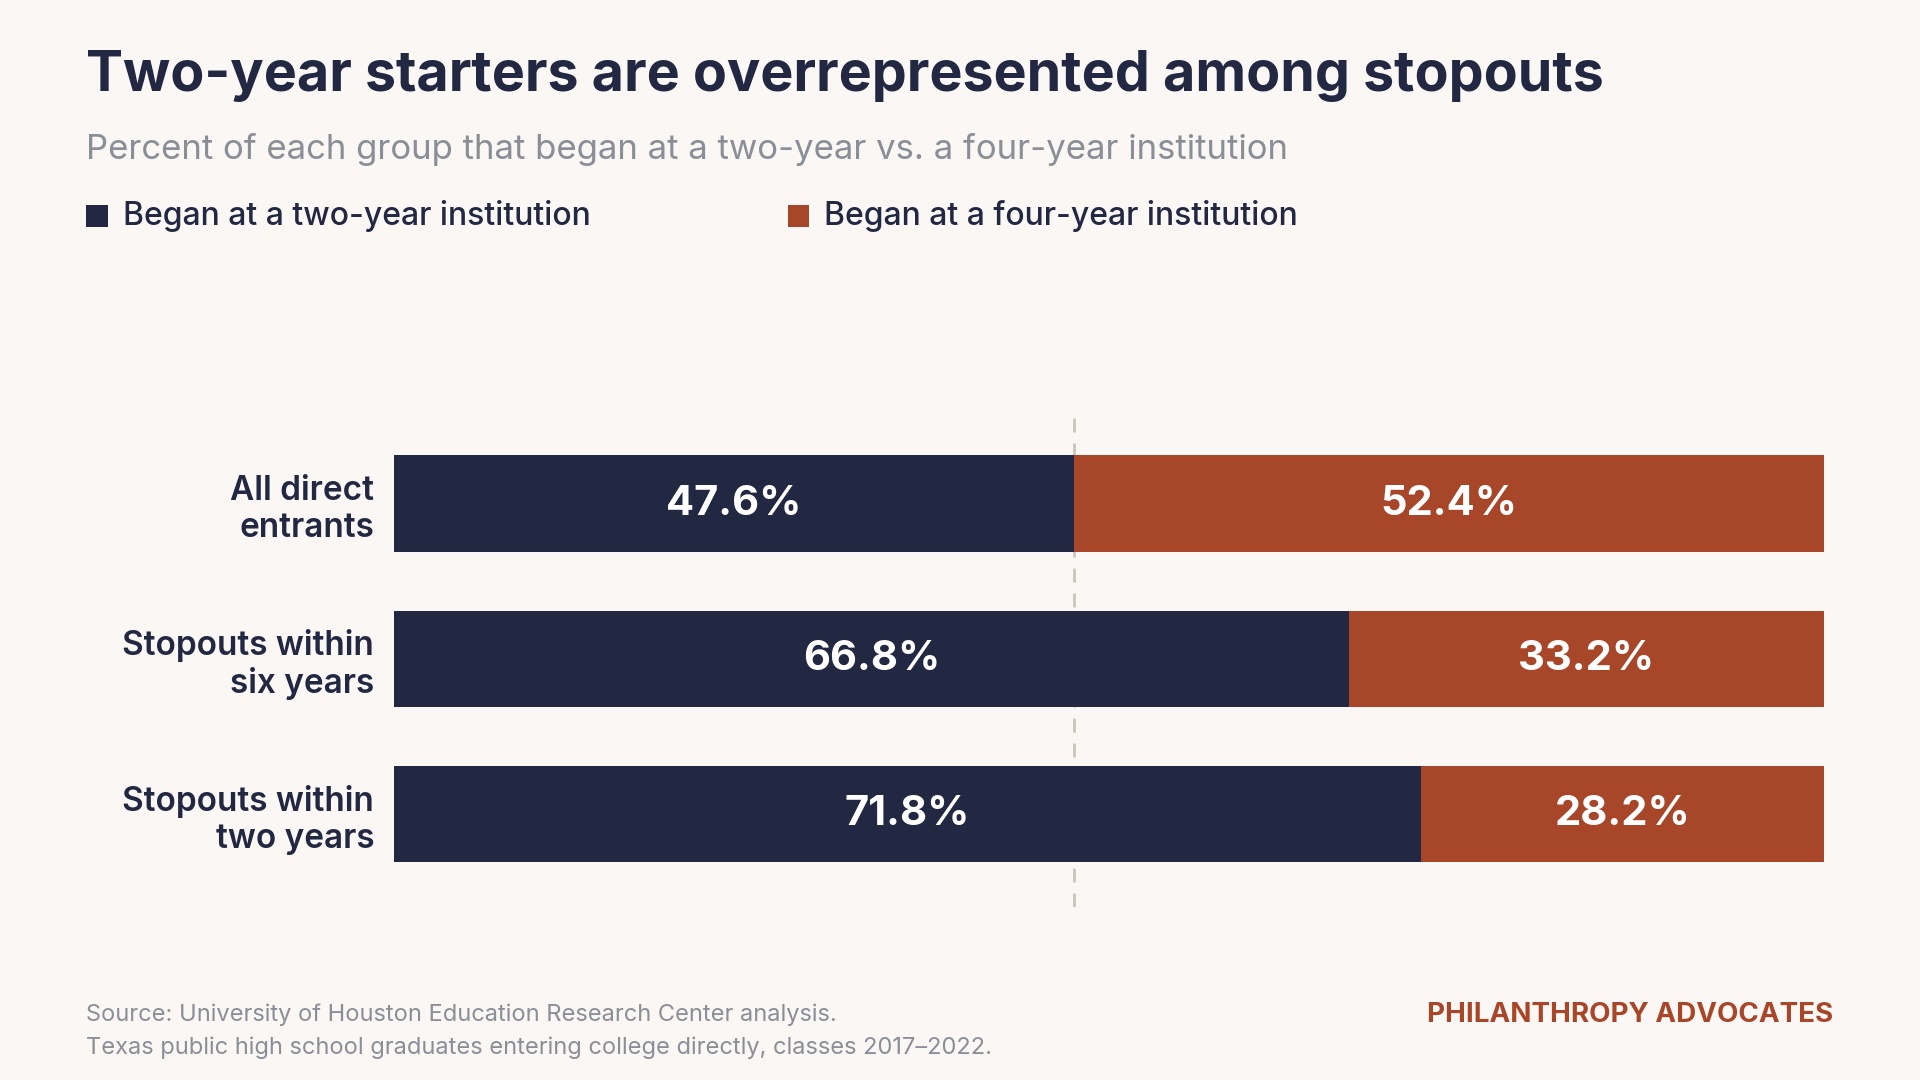
The biggest distinction between stopouts is their starting institution. Looking at the population of stopouts that leave within six years, about two-thirds started at a two-year institution and a third started at a four-year institution. When we look within two years, we continue to see the majority of the earliest leavers come from two-year institutions. Students who begin at community college part time take longer to reach a credential. In 2019, 32.9% of part-time starters at two-year institutions complete within six years, against 48.4% of full-time starters. At four-year institutions, 49.1% of part-time students completed their credential within six years, compared to 71.8% for full-time students (National Student Clearinghouse Research Center).
Economic disadvantage is much more common in stopouts
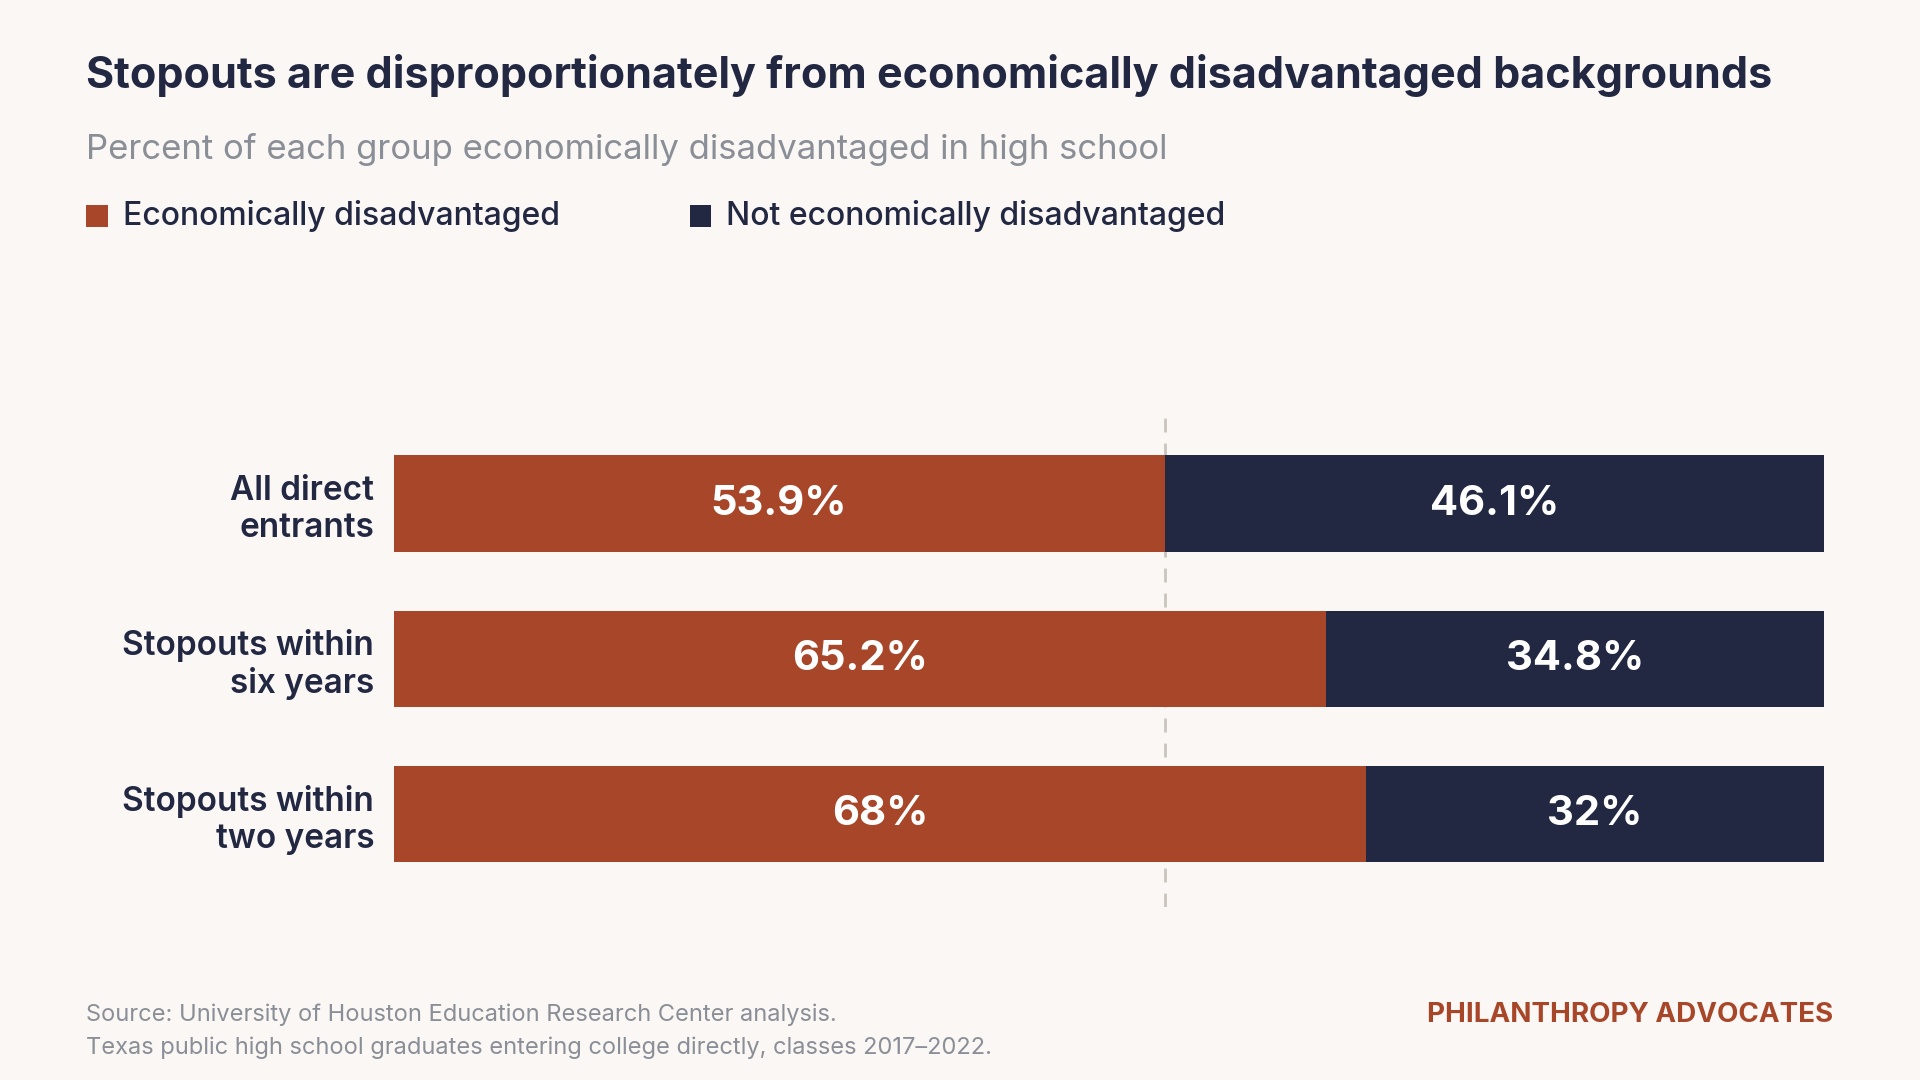
Texas has a large population of students classified as economically disadvantaged. While 53.9% of the classes of 2017 to 2022 were classified as economically disadvantaged, these students comprise about two-thirds of the stopout population. Of students who stopped out within six years, 65.2% were economically disadvantaged in high school, against 34.8% who were not. The concentration is sharper still among the earliest leavers: economically disadvantaged students account for 68% of those who stopped out within two years. The students most likely to leave without a credential arrive already carrying the financial pressures that make continuous enrollment hardest to sustain.
The signals appear years before college
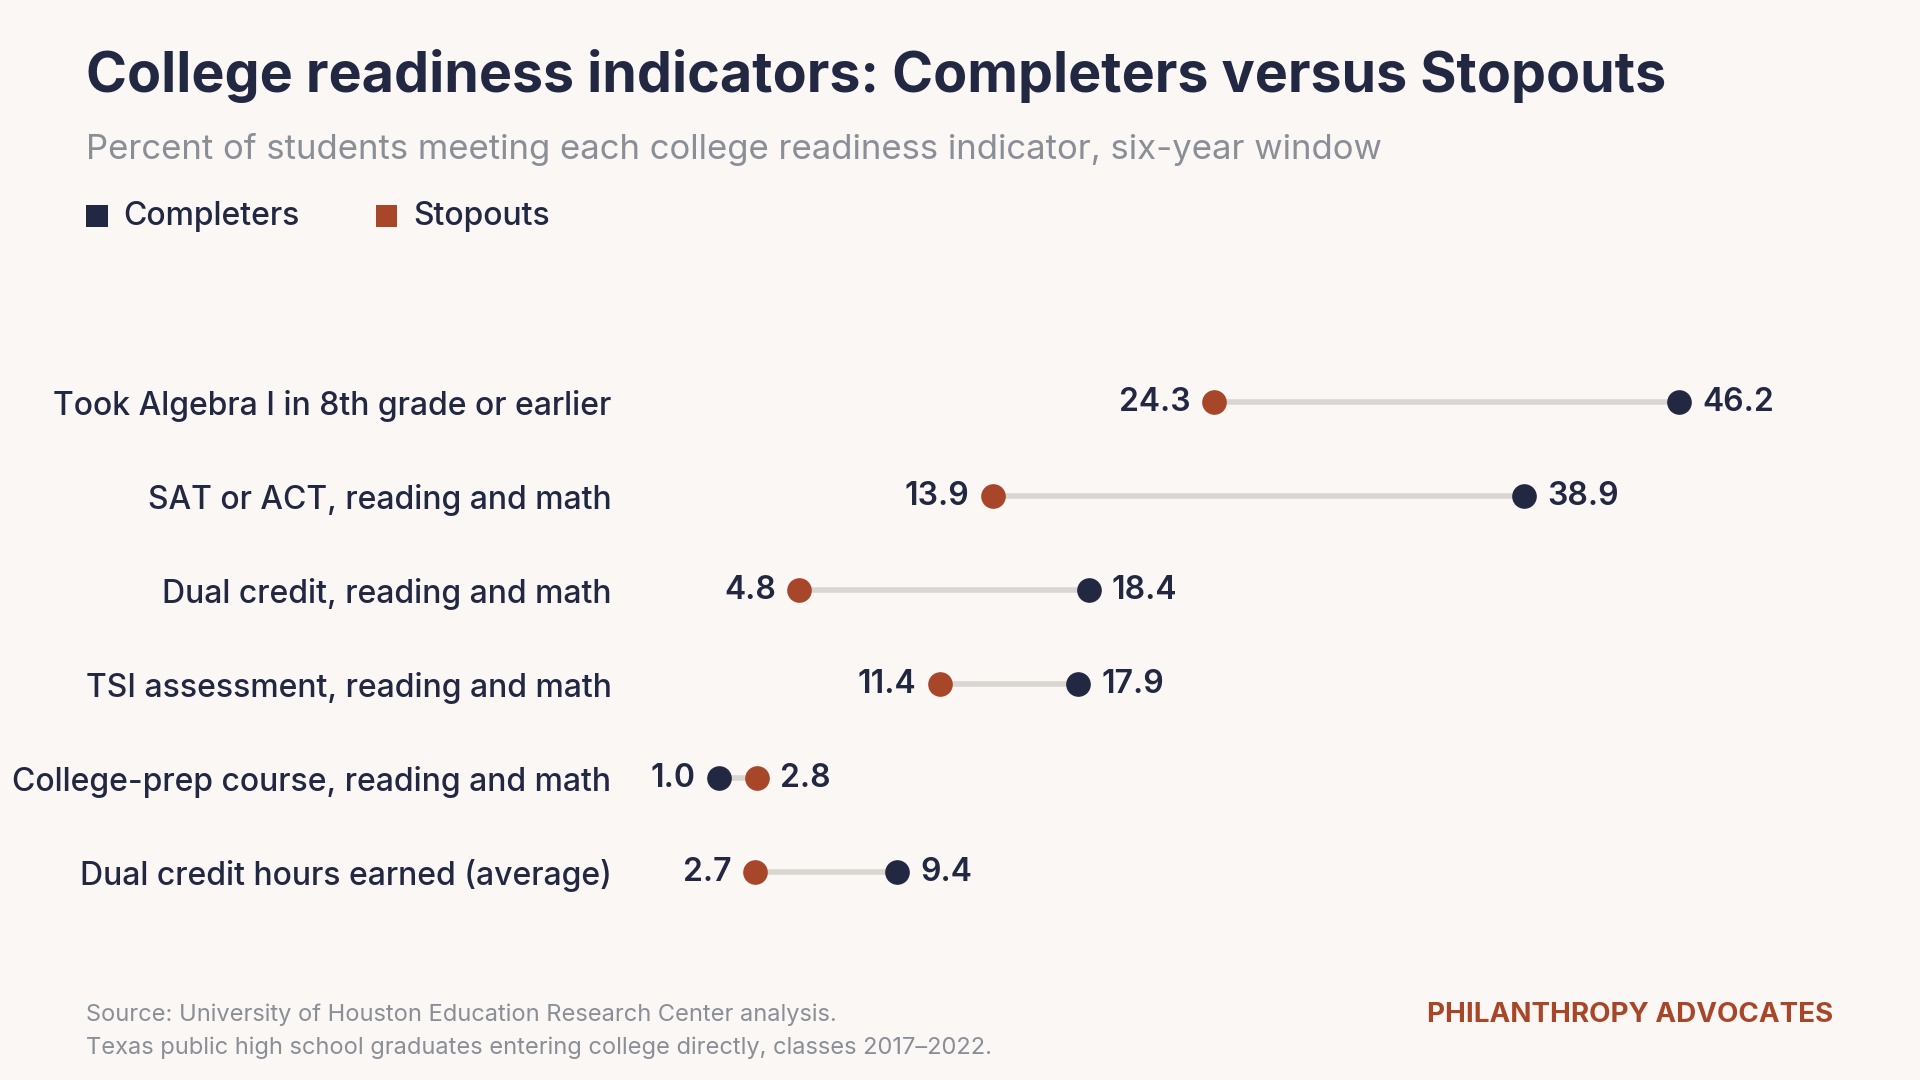
One clear finding is that high school academic readiness metrics matter in predicting completion. Students who show college readiness through the more rigorous academic pathways stopped out at a lower rate. Looking at the six-year window:
- 46.2% of completers had taken Algebra I by grade 8 compared to only 24.3% of stopouts.
- 38.9% of completers arrived college-ready through SAT or ACT reading and math scores, while only 13.9% of stopouts did.
- Dual credit college readiness was achieved by 18.4% of completers, against 4.8% of stopouts.
- 17.9% of completers were college ready by their TSI scores, compared to 11.4% of stopouts.
- Completers earned 9.4 dual credit hours, while stopouts earned an average of 2.7.
- The college prep course indicator shows a different pattern. 2.8% of stopouts met the readiness standard that way, against 1.0% of completers.
Not every stopout is the same: Early vs Late Leavers
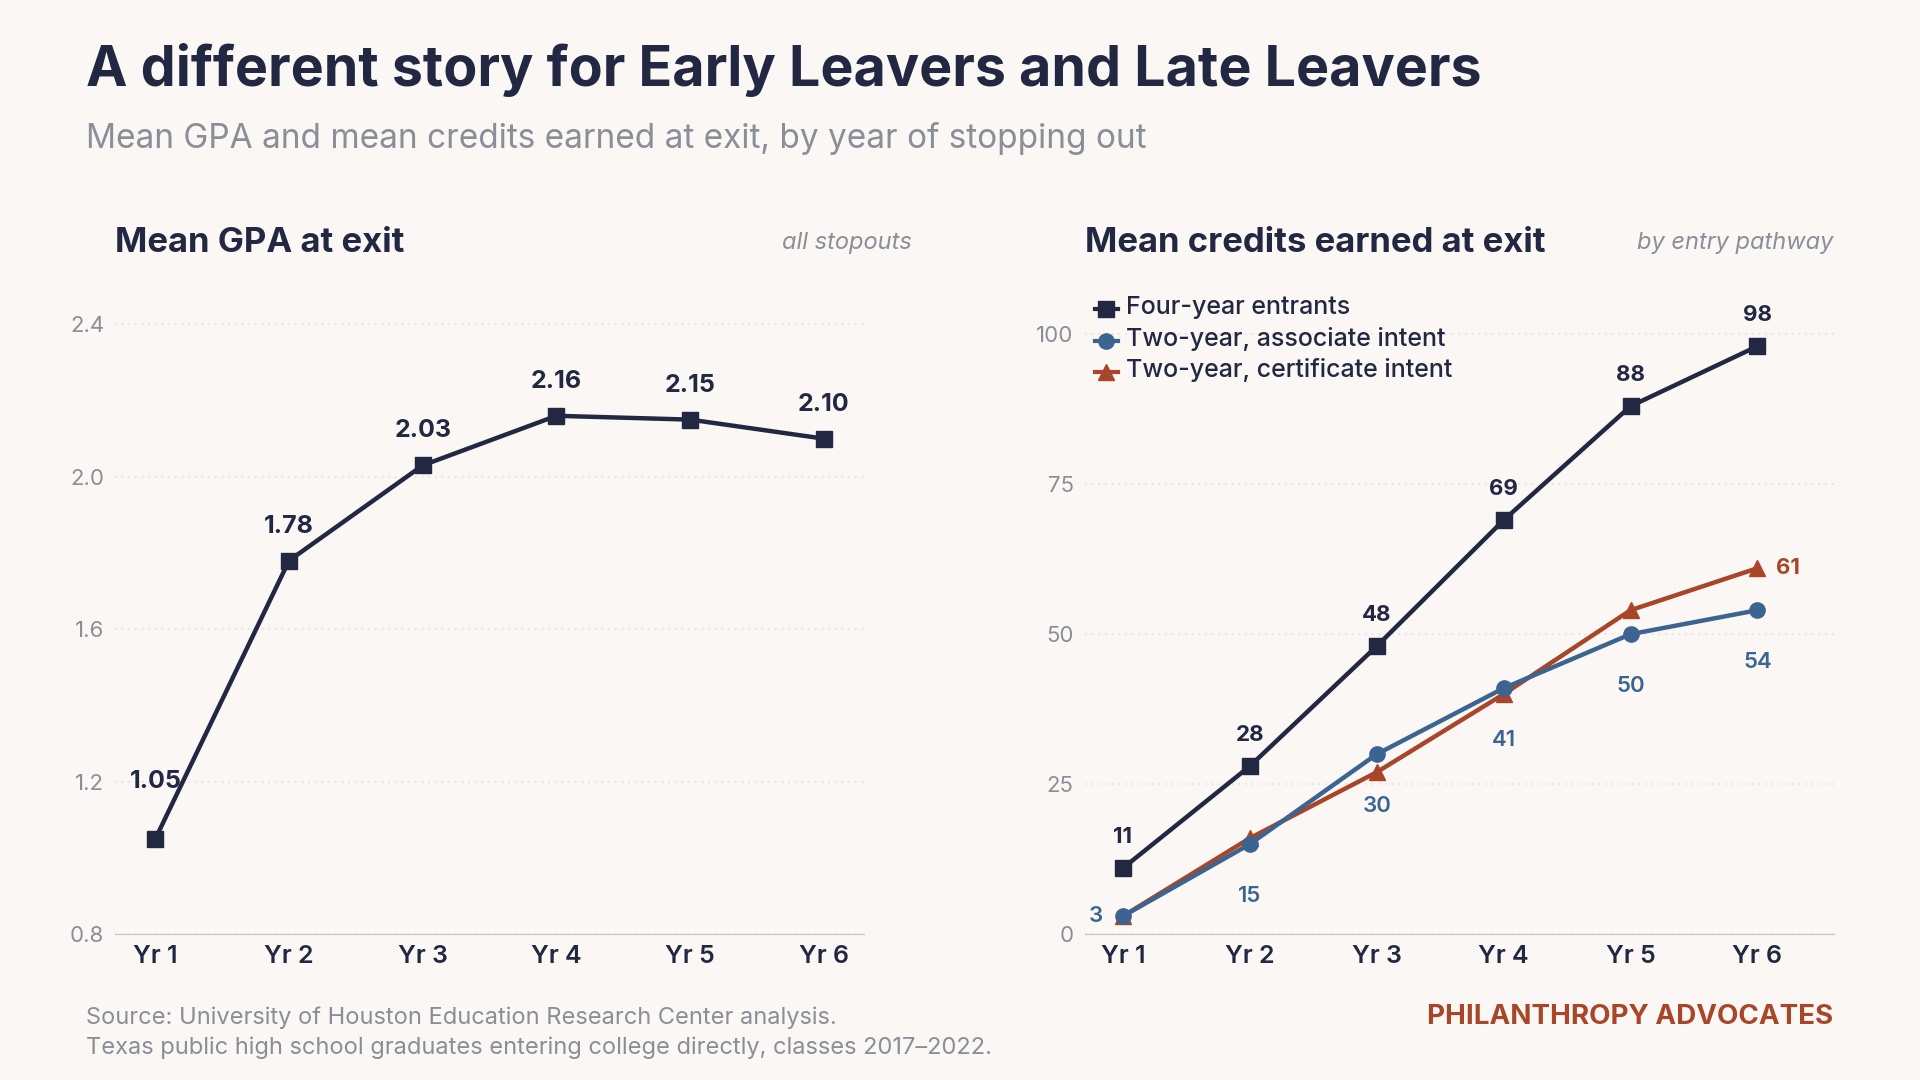
Stopouts can be grouped into two categories: early leavers and late leavers. An early leaver exits in their first year typically with a GPA under 2.0, the median being 1.05. At this level, many of the early leavers would lose access to financial aid. Since the early leavers only completed one year, they have a median of about 3 to 6 college credits. At the other end of the spectrum are the late leavers, this group of stopouts leave in year three or later, often more than halfway to completion. This group has an average GPA above 2.0 and has typically earned 30 to 90 college credits, increasing the later they leave. Since credits needed for completion differ by institution, we break the mean credits by starting institution. For those leaving early the state and institutions might consider additional advising, financial aid, and first-year supports when the attrition is higher. For students leaving later and closer to a credential, different advising efforts and last-mile funding might be effective supports. Students with at least two years of full-time equivalent enrollment prior to stopping out are more likely to re-enroll and complete their credential (National Clearinghouse).
What comes next
Our analysis focuses on what characteristics differentiate the stopout population. These descriptive statistics establish who stops out and what distinguishes them, not why any individual student leaves. Our next phase of analysis moves from description to prediction in a three-part research series. We will extend the analysis to look at student debt. Collectively, Texas stopouts carry more than $1 billion in student debt and hold no credential. Later this year, we will share a deep dive on the background of stopouts and investigate which academic signals predict persistence.
Source: Philanthropy Advocates analysis of Texas statewide student records via the University of Houston Education Research Center, accessed June 2026.
Note: The six-year figures draw on the students whose six-year outcomes we can observe, the two-year figures on all 913,443. The two rates should not be subtracted from one another.
The conclusions of this research do not necessarily reflect the opinion or official position of the University of Houston Education Research Center, the Texas Higher Education Coordinating Board, or the State of Texas.
Photo by Allison Shelley/Complete College Photo Library